Open five real estate websites and search the same address range in Ocean City, New Jersey, and you will get five different answers to a question that sounds simple: what does a home here cost right now. One site will tell you the median is under $850,000. Another will put it near $1.45 million. A third lands right in between. None of them are wrong. They are measuring different things, on different timelines, using different pools of homes, and the gap between them is wide enough to change how you compare Ocean City against any other shore town on your list.
The gap is not a data error. It is the fingerprint of a market where a handful of enormous bayfront sales are pulling the top of the range upward while the bulk of ordinary listings behave like a much calmer, much more negotiable market underneath. Understanding why the numbers disagree tells you more about Ocean City than any single number could.
Same Town, Five Numbers
Here is what five sources reported for Ocean City home prices within roughly the same stretch of 2026, each measuring a slightly different slice of the market:
| Source | What it measures | Figure | Time window |
|---|---|---|---|
| Zillow's home value index | Algorithmic estimate across all homes | $1,128,692 average, up 10.1% year over year | As of August 31, 2026 |
| A national listings site | Median sale price of homes that closed | $1.4 million, up 7.7% year over year | January 2026 |
| A flat-fee listing platform | Median price of current listings | $838,725, down slightly year over year | February 2026 |
| A listings aggregator | Median asking price of active inventory | $1.45 million, up 11% year over year, $851 per square foot | August 2026 |
| A closings-data tracker | Median of actual closed sales, trailing six months | $1,070,000, the highest of any tracked New Jersey market | As of September 5, 2026 |
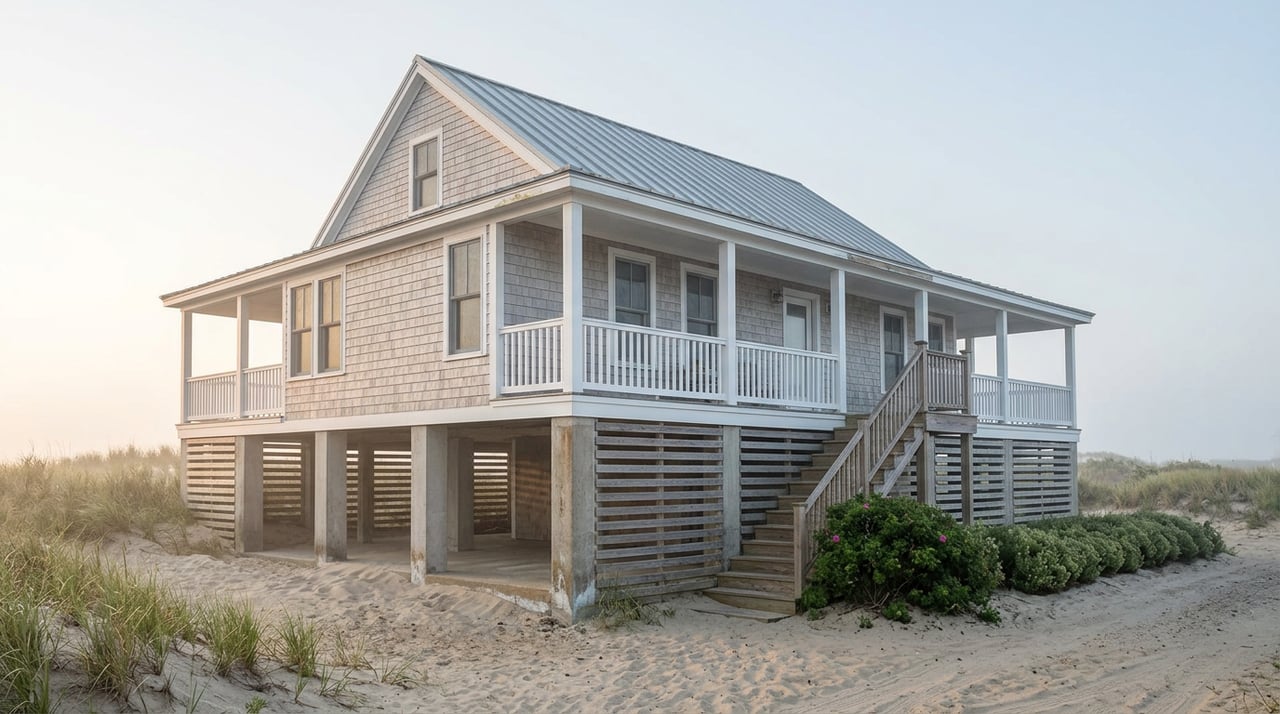
A median is the price in the middle of a sorted list. An average adds every price and divides by the count, which means one $9 million sale can move it as much as a dozen ordinary ones. A list price describes what a seller is asking, not what a buyer eventually pays. A closed-sale figure only counts deals that actually finished. Ocean City's island geography, where a beachfront estate and a downtown fixer-upper sit two blocks apart and both technically belong to the same zip code, makes these differences bigger than they would be almost anywhere else in New Jersey.
The Sales That Are Skewing the Average
The clearest evidence of what is pulling the average upward showed up in Ocean City's 2025 sales data. Citywide, 641 properties changed hands that year, up 13% from the 558 that sold in 2024, and the average sale price climbed to $1,403,700, an 11.4% jump from the previous year's $1,243,367.
Three sales did an outsized amount of that work. The top sale of 2025 closed at 2012 Glenwood Drive for $9,550,000, a brand-new build from Elcon Development that sold before it was even finished. Right behind it, 283 Bayshore Drive closed at $9.5 million, a home on an unusually large lot with views that cannot be recreated elsewhere on the island. Rounding out the top three, 16 Marshall Lane sold for $8.9 million on a lagoon-front lot, beating the previous year's top sale of $7.2 million.
All three were bayfront. For years, beachfront property held the top spot in Ocean City almost automatically. In 2025, the entire top three list flipped to the bay side of the island for the first time.
Why The Bay Beat The Beach
The reasoning behind that flip matters if you are shopping either side of the island. Oversized lots and unobstructed water views are finite on the bay in a way that beachfront lots, constrained by a narrower dune-to-dune footprint, are not. A lagoon-front lot with private dock access offers something a beachblock home simply cannot replicate regardless of price. Buyers with enough capital to compete at the top of the market appear to be paying for that scarcity directly, and it shows up as three record numbers concentrated on one side of the island rather than spread evenly across it.
If you are comparing what your budget buys on the bay versus the beach in Ocean City, the ceiling on the bay side has moved higher than it has historically sat, and that shift alone can distort a citywide average even if nothing changed for the hundreds of other homes that sold that year.
What The Median Hides
While the average was climbing on the strength of a few megasales, the market underneath it was sending a calmer signal. As of February 2026, homes were selling at 96.59% of asking price, a ratio that favors buyers over sellers. Only 2.94% of homes sold above their asking price that month, down sharply from 10% a year earlier. The share of listings taking a price cut rose from 22.7% to 26.27%. Supply sat at roughly 3.35 months, a level that points to a market rebalancing rather than one still overheated.
None of that describes a bidding war. It describes ordinary sellers, in ordinary price bands, adjusting to buyers who have more room to negotiate than they did a year or two earlier. The city's average price and the city's typical listing were, in effect, telling two different stories from the same season.
The summer before offers a useful contrast. In June 2025, 85 homes sold at 97.46% of their original asking price, well above the statewide average of 95.5%, and they sold in an average of 23 days against a New Jersey average of 43. By the end of that same summer, inventory had built up and days on market had stretched out, a pattern that pointed toward a friendlier fall for buyers. The market's temperature changes by season and by price tier in ways a single annual average cannot capture.
The Split Between Who's Buying And Who's Priced Out
A separate read on the local market, published by an Ocean City news outlet this spring, described a widening divide between two groups active in the same market at the same time. On one side, cash-heavy buyers and second-home owners have kept consolidating property along the island's higher-end corridor, largely insulated from mortgage rates because they are not financing the purchase. On the other side, year-round residents looking to buy a first home have found that even with inventory rising slightly to 283 active listings in early 2026 and the median sold price holding above $1.3 million, the monthly cost of ownership still outruns what a typical local paycheck supports.
That split is worth knowing before you compare Ocean City's median to another shore town's median, because the two halves of Ocean City's own market are not experiencing the same conditions. A number that averages a $9.5 million bayfront sale with a $400,000 downtown condo produces a figure that describes neither.
What To Actually Compare
If you are weighing Ocean City against another Jersey Shore town, the citywide average is the wrong tool for that comparison. A more useful approach is to ask for closed sales in your specific price band and on your preferred side of the island, whether that is beachblock, bayfront, or the downtown core, over the trailing few months rather than the trailing year. Ask what the sale-to-list ratio looks like in that band specifically, not citywide. Ask how many months of supply exist at your price point, since 3.35 months citywide can mask a much tighter or much looser number once you narrow to a $600,000 to $900,000 condo search versus a $2 million-plus single-family search.
The five numbers in the table above are not competing claims about the same thing. They are five honest answers to five different questions. The only way to get the answer to your question is to ask it in those specific terms rather than trusting whichever average loads first.
A Few Questions Worth Asking Before You Compare Towns
Why did one site show Ocean City prices up double digits while another showed them down for the same period? An algorithmic home value index smooths estimates across the entire market and tends to move gradually. A monthly average sale price reflects whichever specific homes happened to close that month, so a single high-end sale or its absence can swing the figure sharply from one month to the next even when the broader market barely moved.
Does a softer median in early 2026 mean the market cooled? Not necessarily on its own. A lower median can reflect a shift in what sold that month, such as more condos and fewer single-family homes closing, rather than a drop in what any individual home is worth. Pairing the median with sale-to-list ratio and days on market for your specific price band gives a clearer picture than the median alone.
Is the bayfront now consistently more expensive than the beachfront? The evidence points to the top of the bayfront market pulling ahead in 2025 specifically, driven by a small number of exceptional lots. That is different from every bayfront listing outpricing every beachfront listing, and the two sides of the island still each have their own range depending on lot size, block, and construction age.
If you are trying to figure out what your budget actually buys on a specific block in Ocean City, rather than what a citywide average implies, Alexander Huffard can pull the closed sales in your price band and side of the island so you are comparing the number that applies to your search, not the one that happened to load first.